
The story has been circulating for decades: a storm, a lost shipment and thousands of rubber ducks traveling the planet until they appear on distant beaches. The image is so nice that almost everyone considers it good. But it starts with two errors. They weren’t just ducklings, nor was any scientist able to predict with certainty where each one would appear. What really happened is, if possible, more interesting.
A container overboard and an experiment that no one planned
On January 10, 1992, in the North Pacific, a container fell overboard of the ship Ever Laureloperated by the shipping company Evergreen. Inside they traveled 28,800 plastic bath toys. And here’s the first major correction: it wasn’t 28,800 ducklings. The shipment was divided into four groups of 7,200 units each: ducks, turtles, frogs and rubber beavers.
That detail, which is usually lost when telling the anecdote, matters more than it seems. Ducks, turtles, frogs, and beavers are not shaped or float the same, and some stick out of the water more than others. As we will see, this difference in wind exposure influenced how the researchers later interpreted their movements.
The toys did not have GPS or any tracking devices. So how did your journey piece together? The answer is surprisingly analogous: from the places and dates when people found them and communicated it. Each toy picked up on a beach became a data point, with an approximate position and time.
Accidental tracers without battery or antenna
In oceanography there is a classic technique for studying currents: release floating objects and see where they go. From bottles with messages to instrumented buoys have been used. The 1992 spill offered something similar, albeit inadvertently: almost 29,000 identical objects, released at a known point and date, which began to spread across the ocean.
The first findings arrived in southeastern Alaska, in the Sitka area, throughout 1992. The scientific article that studied the case, Tub Toys Orbit the Pacific Subarctic Gyre (Ebbesmeyer et al., Eos2007), places these first toys in August and September of that year, at an approximate distance of 3,200 to 4,000 kilometers from the accident site. A note of caution is in order: the sources do not entirely agree on the exact chronology. For example, a previous NOAA report places the first reported findings beginning in November 1992, with further appearances during the summer of 1993.
In any case, the underlying idea is clear. The toys worked like accidental tracers of the surface circulation of the ocean: they did not measure anything by themselves, but their appearance on different coasts, over months and years, drew a trail that could be compared with what the models predicted.
What is the subarctic gyre and why does it complicate everything?
The setting for this story is the subarctic gyre of the North Pacific, a large system of currents that circulates in a more or less closed manner through that region of the ocean. Such a turn can keep objects drifting for years and, what is more interesting, it does not move them along a single track: different routes and the changing action of the wind can separate objects that started from the same place.
This is where the model came into play. DARK (acronym in English for an ocean surface current simulation system). The researchers used it to reconstruct which trajectories were plausible from the point and date of the spill. OSCURS combined long-term mean currents with current estimates derived from daily atmospheric pressure data, calculated over a grid of about 90 kilometers. And, importantly, it was adjusted taking into account that these toys stuck out further from the water and were more exposed to the wind than other floating objects.
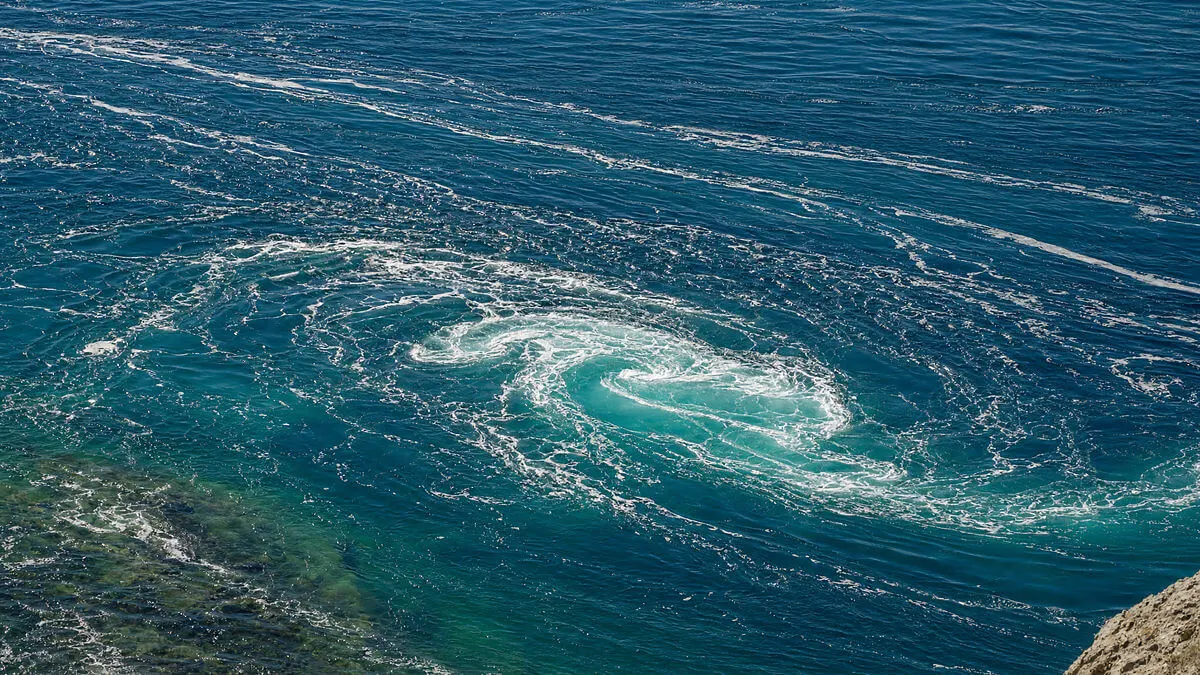
To explore possible routes, the team released in the simulation 70 virtual objects from the accident area and followed them for 11.5 years. The result was not a single, clean line, but a range of trajectories: several possible turns around the turn and some exit routes from the system. The study estimated orbit times of approximately 2.11-2.16 years, 2.72-2.80 years, and 3.30-3.63 years, depending on the simulated route.
What could be estimated and what could not
Here it is advisable to stop before falling into the mythical version of history. These intervals describe possible routes on a regional scalenot the travel time of each specific toy. And that distinction is the heart of the matter.
The spill made it possible to evaluate circulation models and estimate probable routes on a large scale. What it did not allow was to predict exactly where or when each of the 28,800 pieces would appear. He couldn’t do it, for several reasons: the exact initial conditions of each toy were not known, their recovery depended on someone finding and reporting them, and many were simply never seen again.
The scientific value, therefore, was of another type. It served to move from a false, intuitive idea—an object follows a current like a conveyor belt—to a more realistic description, in which wind, changing currents, coastlines, and diverging paths separate objects that started together. The toys, drifting for long periods, revealed circulation patterns that are difficult to capture with more conventional observations.
And the famous fleet of ducklings in Scotland?
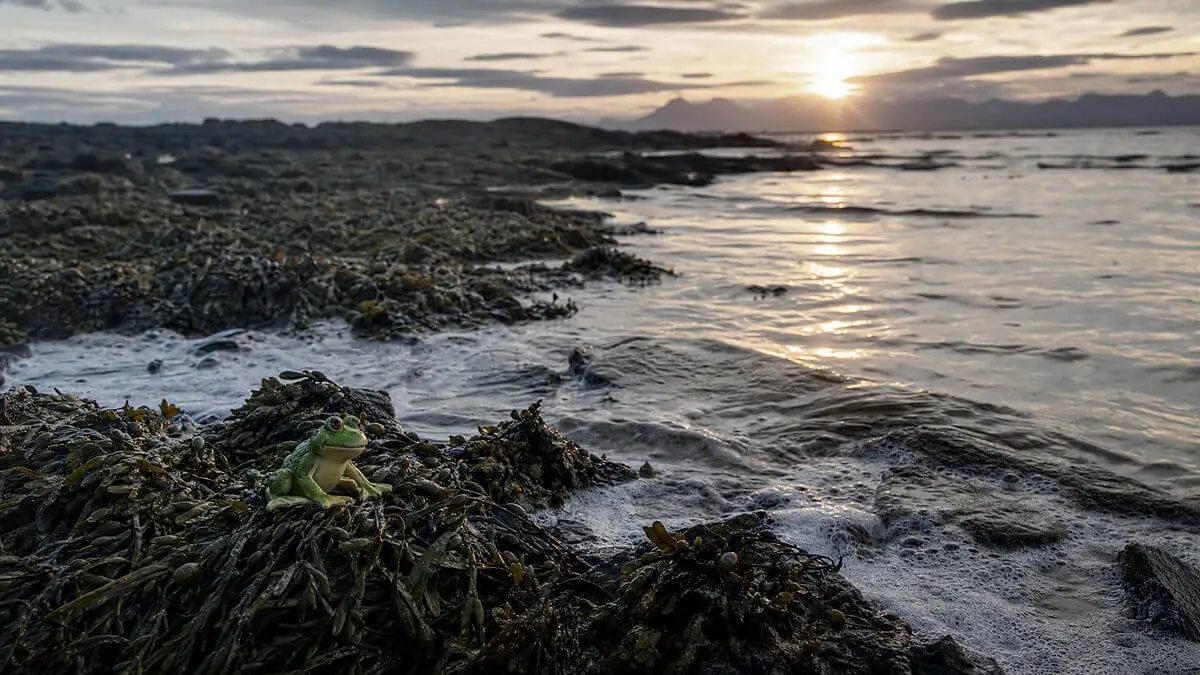
The popular version ends the story with thousands of ducklings arriving together on the shores of Scotland. The available evidence suggests something much more modest. Yes, there were very distant finds: one documented corresponds to a frog from this shipment found on the Isle of Skye, in Scotland, in August 2003, more than a decade after the accident.
But it was an isolated find, not the simultaneous arrival of a fleet of thousands of toys. And the route to the North Atlantic was probably not a direct crossing from the Pacific: the most popular hypothesis points to a complex route through the Bering Strait and the transport associated with the Arctic ice. It is a plausible explanation, although not a complete and verified reconstruction for every piece found outside the Pacific.
From toy to waste: the other side of the experiment
There is an uncomfortable detail in this funny story. The same mechanisms that turned toys into useful current tracers are those that transport plastics and waste enormous distances across the oceans. What helps to understand surface circulation also makes it difficult to attribute the origin of floating debris and plan its removal.
That is why the episode remains instructive decades later. Not because rubber toys predicted the future – they did not – but because they clearly show how science works: models are built, contrasted with real observations, however imperfect, and the understanding of the system is refined. The data, in essence, are not used so much to guess the destination of each object as to estimate which routes are probable and which are improbable. The next time someone summarizes this story as “28,800 ducklings arrived in Scotland”, you know how many corrections can fit into that sentence.
The data, in essence, are not used so much to guess the destination of each object as to estimate which routes are probable and which are improbable.